State of Demo Automation 2026
This report looks at demo management and setup, best practices when using demo automation, and its impact on the sales cycle.
For the past four years, we’ve created a State of the Interactive Product Demo Report to see how marketers use interactive demos on their websites.
With a fast-growing number of sales and sales engineers adopting Navattic for demo automation, this year, we wanted to see how SEs demo in their day-to-day and how they are using automation at different points in the sales cycle.
Between 40k+ demos created on Navattic in 2025, buyer engagement data, and survey data from 70+ SEs conducted with the Presales Collective, this report looks at typical SE demo management and setup, best practices when using demo automation, and its impact on the sales cycle.
How do SEs Demo in 2026?
There’s a clear gap between the highest-impact work sales engineers are capable of - designing tailored, consultative demo experiences for high-value deals and strategic accounts - and how they actually spend their time day to day.
Instead of acting as strategic advisors focused on complex, high-value opportunities, many SEs are stuck delivering the same core demos repeatedly, leaving less time for the deals that matter most. According to our survey of 70+ sales engineers, they are spending significant time on repetitive demos.
94% conduct repetitive demos at least sometimes, while 34% report they are often conducting repetitive demos. Only 6% never conduct repetitive demos.
34% of respondents also said their standard demo has little to no customization.
SEs conduct an average of 7 demos per week. A standard demo (including prep) takes an average of 3.6 hours, which means an SE could be spending anywhere between 11 and 25 hours a week on prepping and running standard, repetitive demos. Instead of time spent where it matters most - tailored, proof of value demonstrations to close deals.
On the flip side, for SEs who are doing custom demos, they take twice as long as a standard demo and are reported as the most time-intensive task.
This also impacts the buyer experience - most often prospects need to wait for SE availability to see the product. Most often, it takes 2 calls before a prospect connects with an SE.
Below, we’ll dive further into those survey results and how demo automation can help free up SE time, so they can focus on more strategic, custom demos.
How Demos Impact SEs Work?
Survey Demographics: What Products and Industries Require SE Demos
This section draws on survey data from 70+ sales engineers and presales professionals, collected in December 2025 and January 2026 with the Presales Collective. Respondents represent a range of B2B SaaS companies across company sizes and industries.
Most of the sales engineers surveyed were individual contributors and managers who sell moderately complex enterprise software.
This section looks at the demographics of those who completed our survey.
| Industry Distribution | % of Respondents |
|---|---|
| Enterprise Software | 49% |
| Marketing Technology | 9% |
| Financial Technology (FinTech) | 7% |
| Cloud Infrastructure & Services | 7% |
| AI/Machine Learning | 7% |
| Human Resources Technology | 5% |
| Data Analytics & Business Intelligence | 5% |
| Other | 12% |
| Size of SE Team | % of Respondents |
|---|---|
| 1-3 | 21% |
| 3-10 | 32% |
| 11-25 | 11% |
| 26-50 | 15% |
| 51-100 | 4% |
| 101-200 | 4% |
| 200+ | 13% |
SE Team Setup
This section looks at the most common structure for an SE org and the demo activities they perform on a week-to-week basis.
SEs most often support 3 AEs and spend most of their time on custom demos, followed closely by standard demos. On average, they perform 7 demos a week, majority are moderately customized. However, 94% of SEs also report conducting repetitive demos.
| Activity Type | High | Mid | Low |
|---|---|---|---|
| Standard Demos | 25% | 51% | 24% |
| Custom Demos | 33% | 52% | 15% |
| POCs/POVs | 26% | 24% | 50% |
Demo Impact on the Sales Cycle
This section looks at how demos impact the overall sales cycle and how many demo touchpoints are required to close a deal.
The average sales cycle takes 6 months, with 3 demos on average required to close (4 - 5 demos is the most common range). A standard demo (including prep) takes on average 3.6 hours of SE time, and custom demos 7 hours.
Demo Environment Maintenance
This section looks at how many SEs have a separate demo environment, the setup required, and dedicated resourcing.
The majority of SEs have a dedicated demo environment; however, only 39% have dedicated resourcing. On average, maintaining demo environments takes 3 hours a week per person and is most commonly manually refreshed.
| Hours | Percentage |
|---|---|
| 0 hours | 17% |
| 1 hour | 25% |
| 2 hours | 27% |
| 3 hours | 5% |
| 4 hours | 12% |
| 5 hours | 3% |
| 6 hours | 2% |
| 7 hours | 2% |
| 8 hours | 5% |
| 10 hours | 2% |
| 25 hours | 2% |
Best Practices for Automated Demos
This section draws from 40k+ demos created on Navattic in 2025 and corresponding CRM buyer engagement data to identify the best ways to reduce the need for repetitive demos and free up SE time for strategic engagements.
What is Demo Automation?
Demo automation reduces the need for repetitive overview demos by giving prospects access to your product earlier in the sales cycle.
Typically, this is done through one of three ways:
- Self-service interactive demos that prospects can use to explore key features and talk tracks before or after a live sales call
- Video content that walks prospects through key workflows and value moments
- Sandbox demo for sales reps to show a high-level cloned version of the product on a live sales call
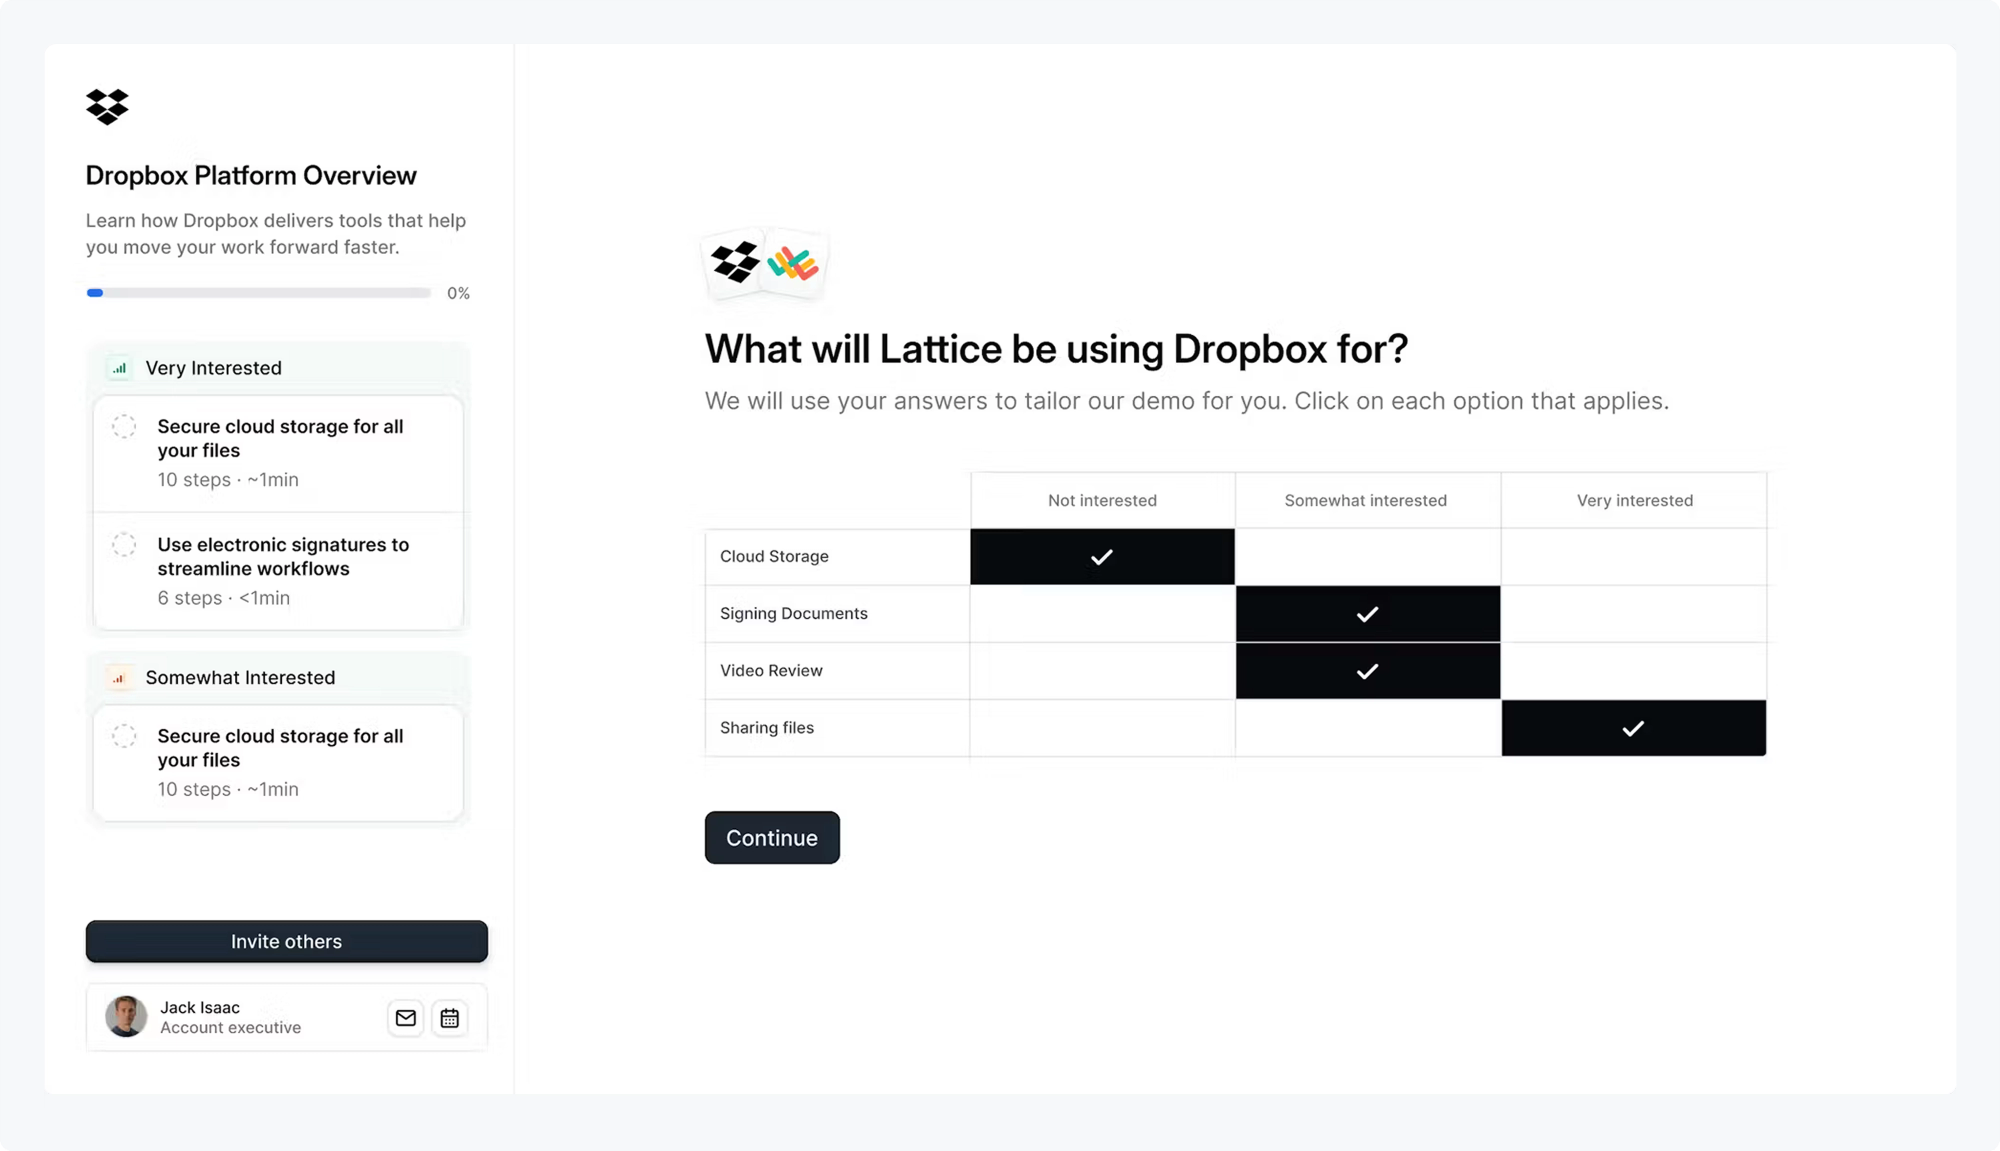
They also present prospects with a modular option upfront to choose the parts of your product they are most interested in.
This gives prospects a custom self-paced demo to explore on their own time, and gives SEs and reps earlier discovery data.
Here is an example of what an automated, interest-based demo looks like
Automated Demo Setup
This section looks at when you’re sharing an automated demo, what is the most common setup and structure for that demo.
The majority of automated demos are interest-based, meaning the prospect can choose what they want to view upfront. Interests are usually by use cases, product lines, or features. Most commonly, demos have between 3 and 10 interests.
Interests are a way to show different features, use cases, or product lines within one demo.
| Number of interests | % of respondents |
|---|---|
| 2 | 15% |
| 3 - 5 | 27% |
| 6 - 10 | 27% |
| 11 + | 32% |
Demos can also be personalized by the prospect's name, company, or by actually no-code editing the data within the demo environment.
When sharing a demo, you can choose how the recipient is able to access the demo. The recipient can either:
- Fill out their name or email
- Self-register to automatically be entered into the demo, or request access
| Gate type | % of demos |
|---|---|
| Name gate + self-register | 70% |
| Email gate + self-register | 18% |
| Email gate + request access | 9% |
| Name gate + request access | 2% |
Demo Automation Sales Impact
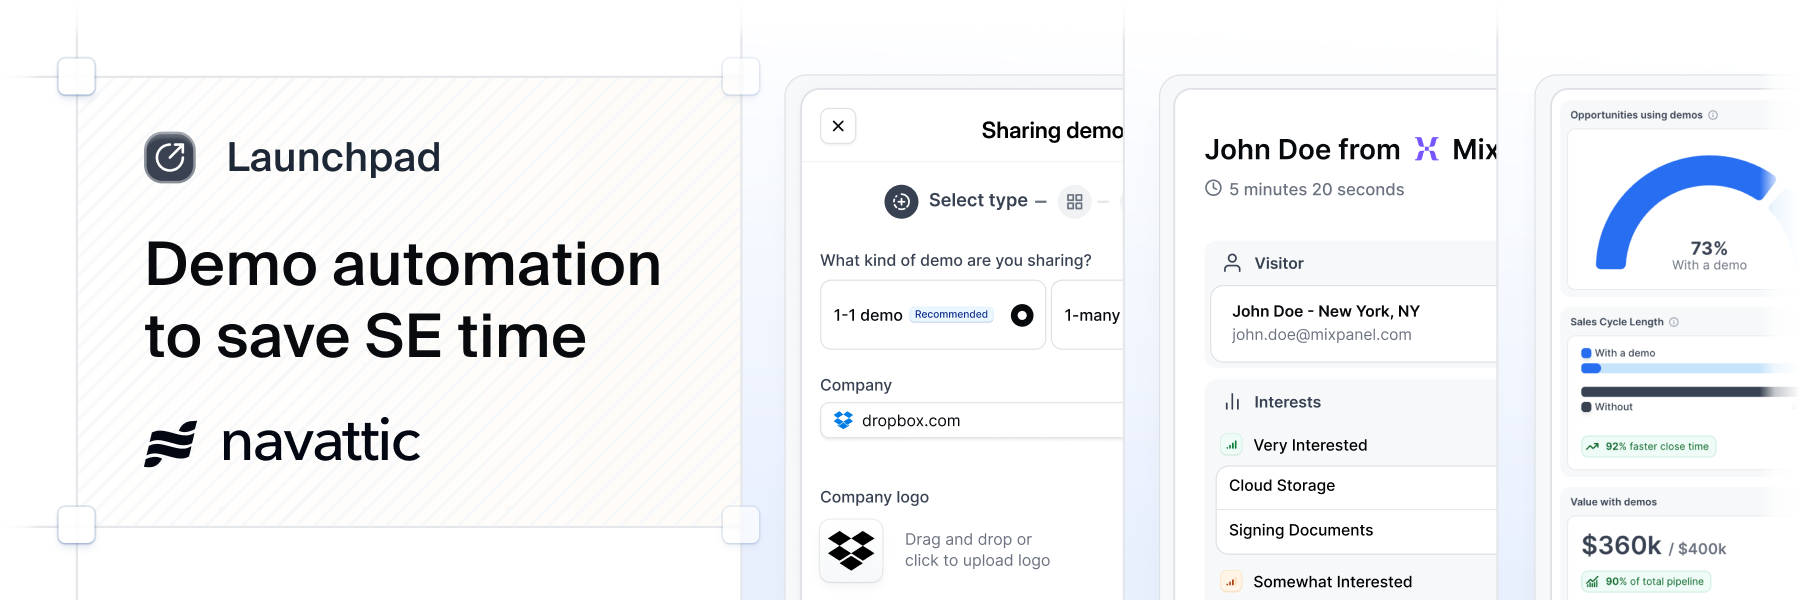
This section pulls CRM opportunity data from customers using our demo automation solution, Launchpad, to see how automated demos shared during the sales cycle impact sales length and win rates.
Deals that include automated demos have a 6% higher win rate and 19 day faster sales cycle. Win rates can reach 72% when demos are sent within the first 14 days. Sending 2-3 automated demo touchpoints in a sales cycle can also get win rates to 72%.
| Metric | Time |
|---|---|
| Average per share link | 5 minutes 5 seconds |
| Demo timing | Win rate |
|---|---|
| No demo touch | 59% |
| First touch within 14 days of creation | 72% |
| First touch 15 or more days after creation | 66% |
Takeaways: Top SE Demo Use Cases
This section recaps best practices for how to use demo automation in different parts of the sales cycle.
Pre-Call Discovery
Prospects typically connect with an SE after 2 calls. Automated demos can fill this gap by providing early product access and getting more discovery data from them, setting your team up for more success on that first SE-led call.
Benefits:
- Buyers self-qualify and arrive at SE calls with product knowledge
- SEs can skip generic overviews and start with deeper conversations
- Qualification improves as low-fit prospects self-select out earlier
Sales cycle impact: Demos that are sent within the first 14 days of creating a deal have a 72% win rate, compared to 59% for deals without demo touches.
Pre-call demo setup: If you are going to send a demo for pre-call discovery, we recommend an interest demo with 3-10 interest areas so prospects can choose what part of the product they want to explore.
Post-Call Enablement
With deals requiring 3 demos on average to close, automated demos serve as follow-up resources to help speed up the sales cycle after the initial SE led demo. They let buyers explore independently, share with stakeholders, and build internal consensus.
Benefits:
- Champions have custom and engaging leave-behind material
- Demo sharing uncovers additional stakeholders
- Technical evaluators have more self-service resources
- The buying committee has reference material they can return to
Sales cycle impact: The average sales cycle (according to survey respondents and our data) is around 5 to 6 months, while deals with demo touches have a sales cycle of around 4 months and close on average 19 days faster. The highest win rate for deals with demos (72%) also occurs when there are 2 to 3 demo touches within the deal.
Post-call demo setup: If you are going to invite multiple stakeholders, make it as frictionless as possible for them to view the demo by only asking for their name and letting them self-register. Also consider personalizing the demo data for that specific person or account.
Feeling inspired to try demo automation?
Learn more about our demo automation platform, Launchpad, that lets SEs and sales:
- Store and organize all your demo assets in one place
- Create custom modular demos from anywhere
- Receive real-time deal alerts on demo engagement
- Tie demo engagement to revenue in your CRM
Turn demos into deals.
Build interactive product demos that engage buyers and close deals faster.